
My TTFB Was Fine. My Site Was Still Slow. Here’s What PageSpeed Wasn’t Telling Me
I want to start with the assumption I walked in with, the one that led me straight past render delay without realising it was there, because I think it’s the same assumption most people make, and it’s wrong in a specific, useful way.
I assumed that if my server responded quickly, my site would feel fast. That seems obvious enough to not even need saying. Fast server, fast site. Except it isn’t true, and I only found that out because I went looking for a completely different answer and ran straight into this one instead.
What I was actually trying to prove
A little while back I was in the middle of deciding whether to migrate this site from Hostinger to Cloudways. Before making that call, I wanted a real number on server response time, not a guess, not a vibe, an actual measured figure. So I ran griffithpromarketing.com through PageSpeed Insights repeatedly, both mobile and desktop, using the LCP breakdown tool to isolate Time to First Byte from everything else happening on the page.
The TTFB came back at 190 milliseconds. Every single run, both device types. Lighthouse doesn’t even flag TTFB as a concern until it passes roughly 600ms, so I was sitting comfortably under a third of that line. That part of the story was simple and, frankly, a little anticlimactic. My server wasn’t the problem. Case closed, I thought.
Except the same breakdown that gave me that clean TTFB number also handed me a second figure I hadn’t gone looking for, and that second figure turned out to be the actual story.
The number I wasn’t expecting
Sitting right next to Time to First Byte in that same LCP breakdown is a metric called Element Render Delay. It measures something different and, it turns out, something more revealing: the gap between the browser receiving the server’s response and the browser actually painting the largest visible element, in my case, the page’s main headline, onto the screen.
TTFB tells you how fast your server answers the phone. Render delay tells you how long the browser sits there after that, doing other work, before it actually shows the visitor anything meaningful.
And on my site, that second number was doing almost all of the damage.
Here’s what I recorded across two separate PageSpeed runs, twenty-five minutes apart, nothing on the site changed between them:
| Run | Device | Score | TTFB | Render delay |
|---|---|---|---|---|
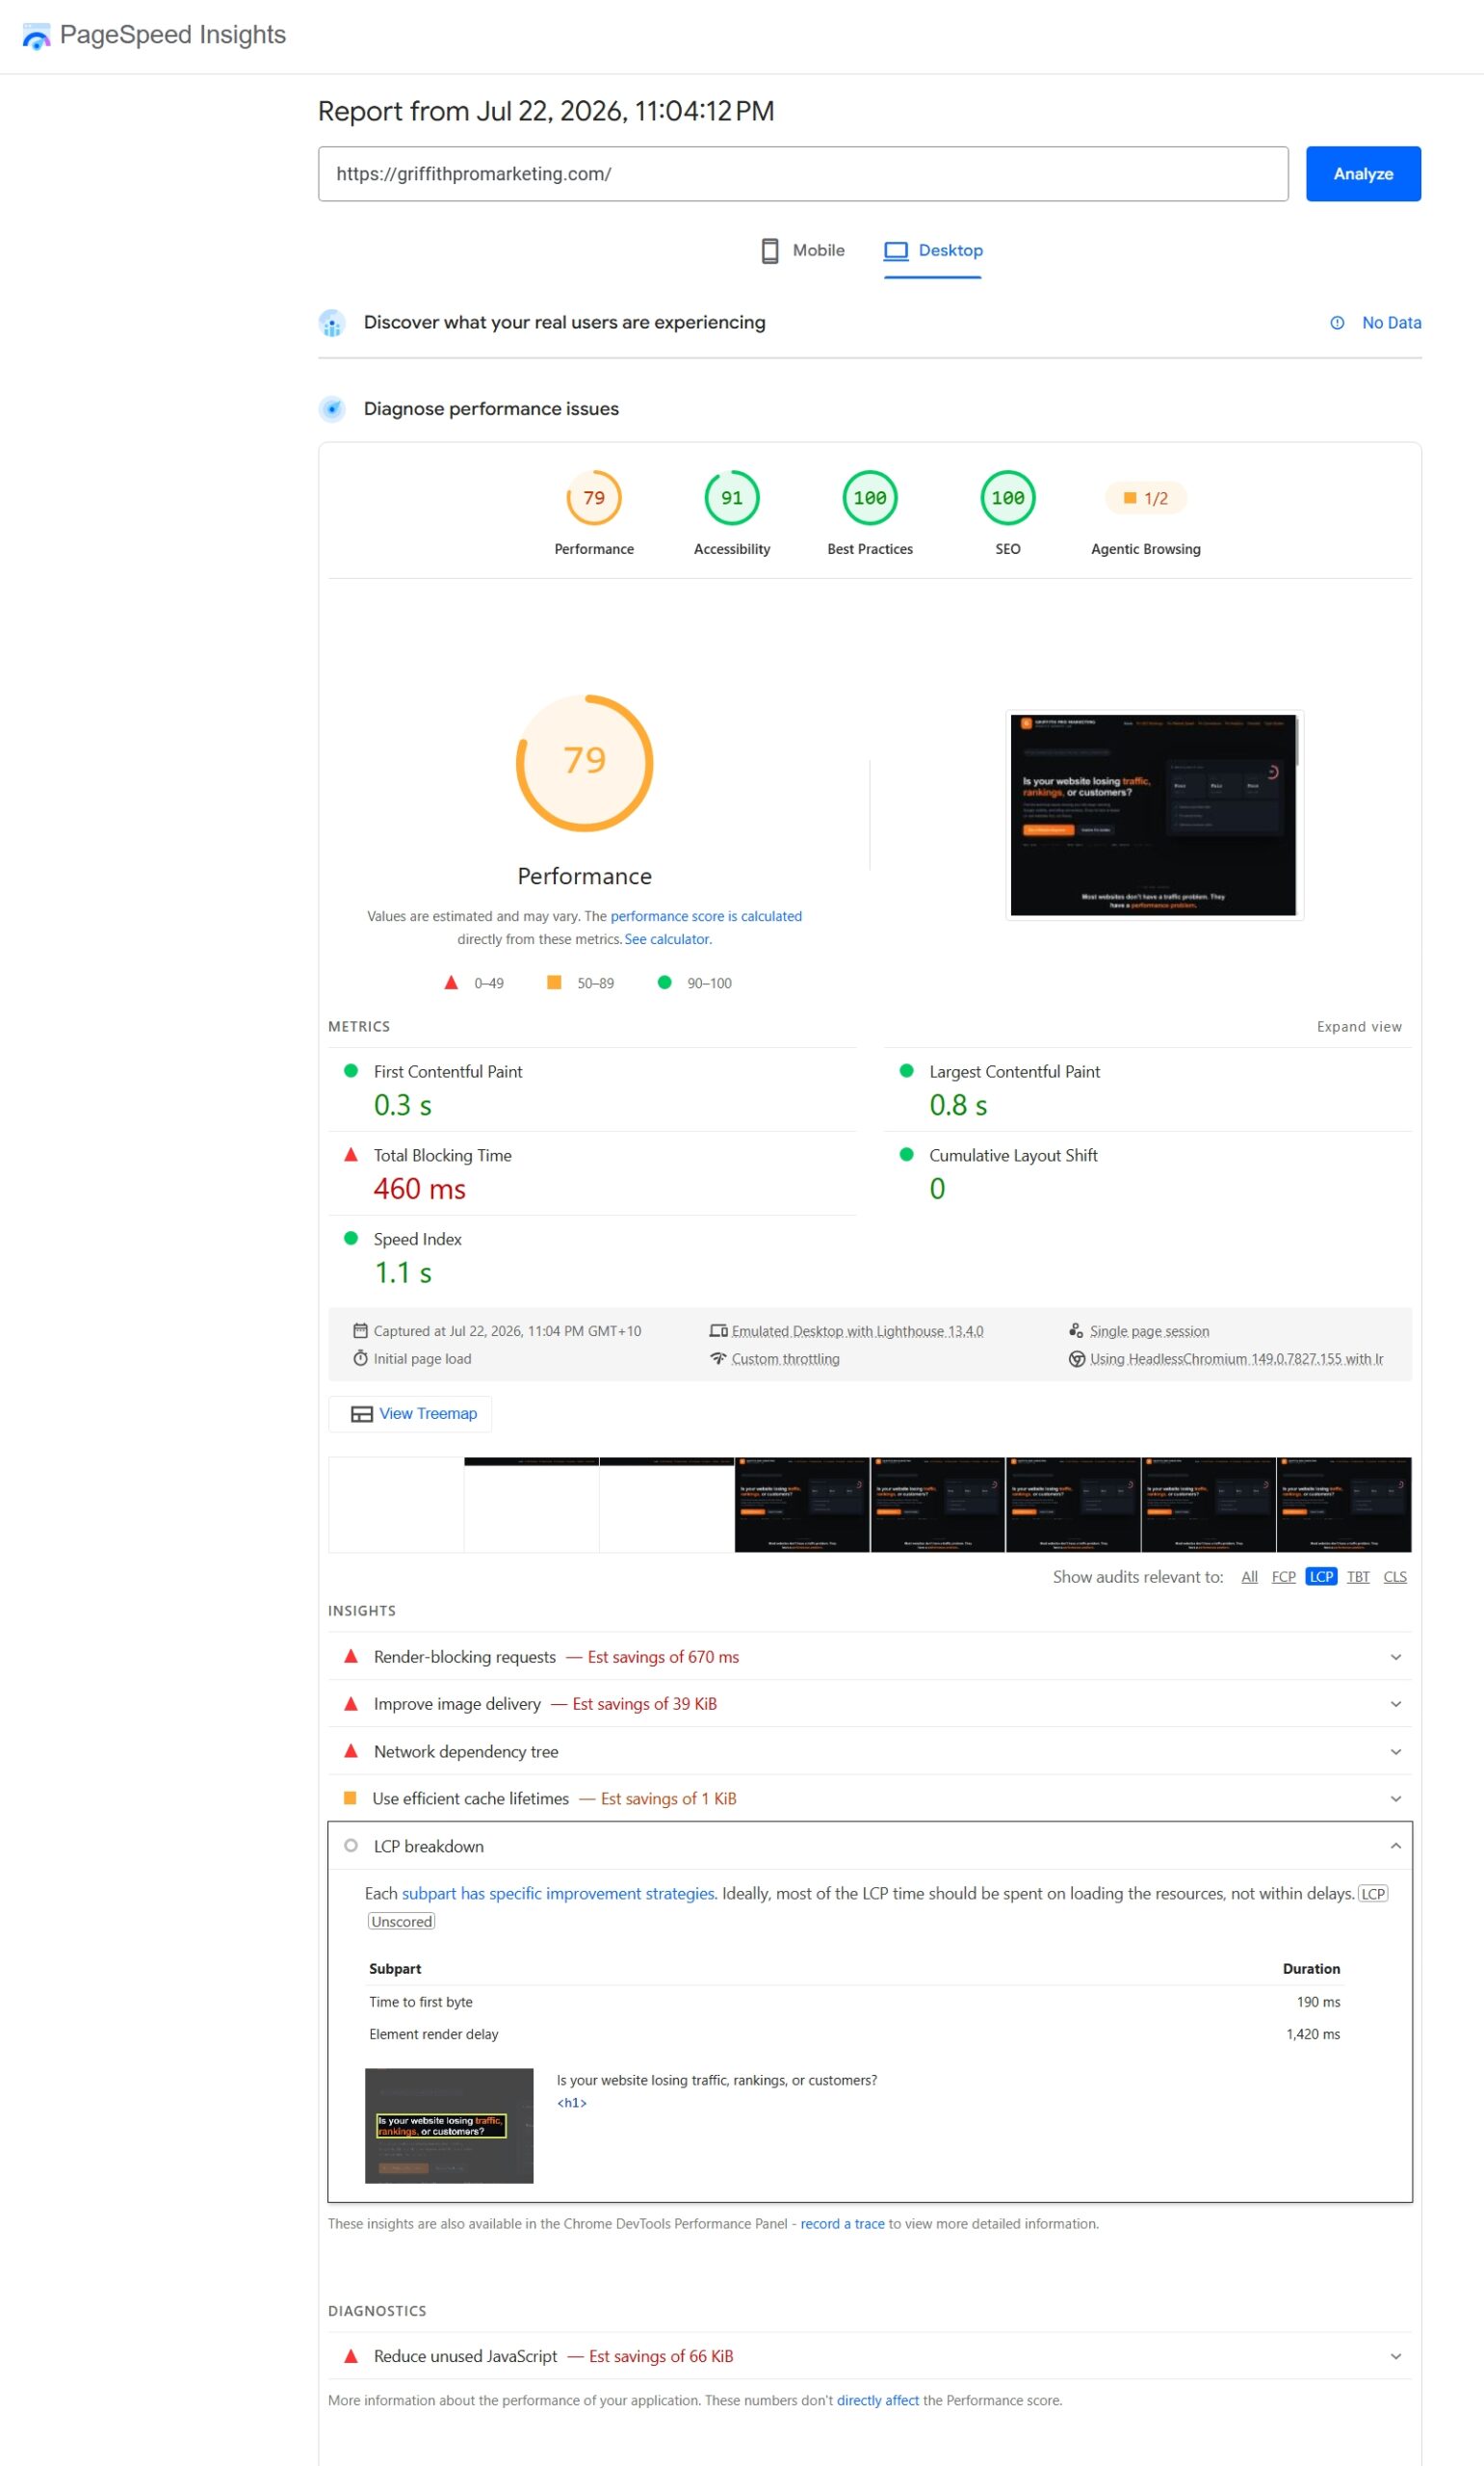
| 11:04pm | Desktop | 79 | 190ms | 1,420ms |
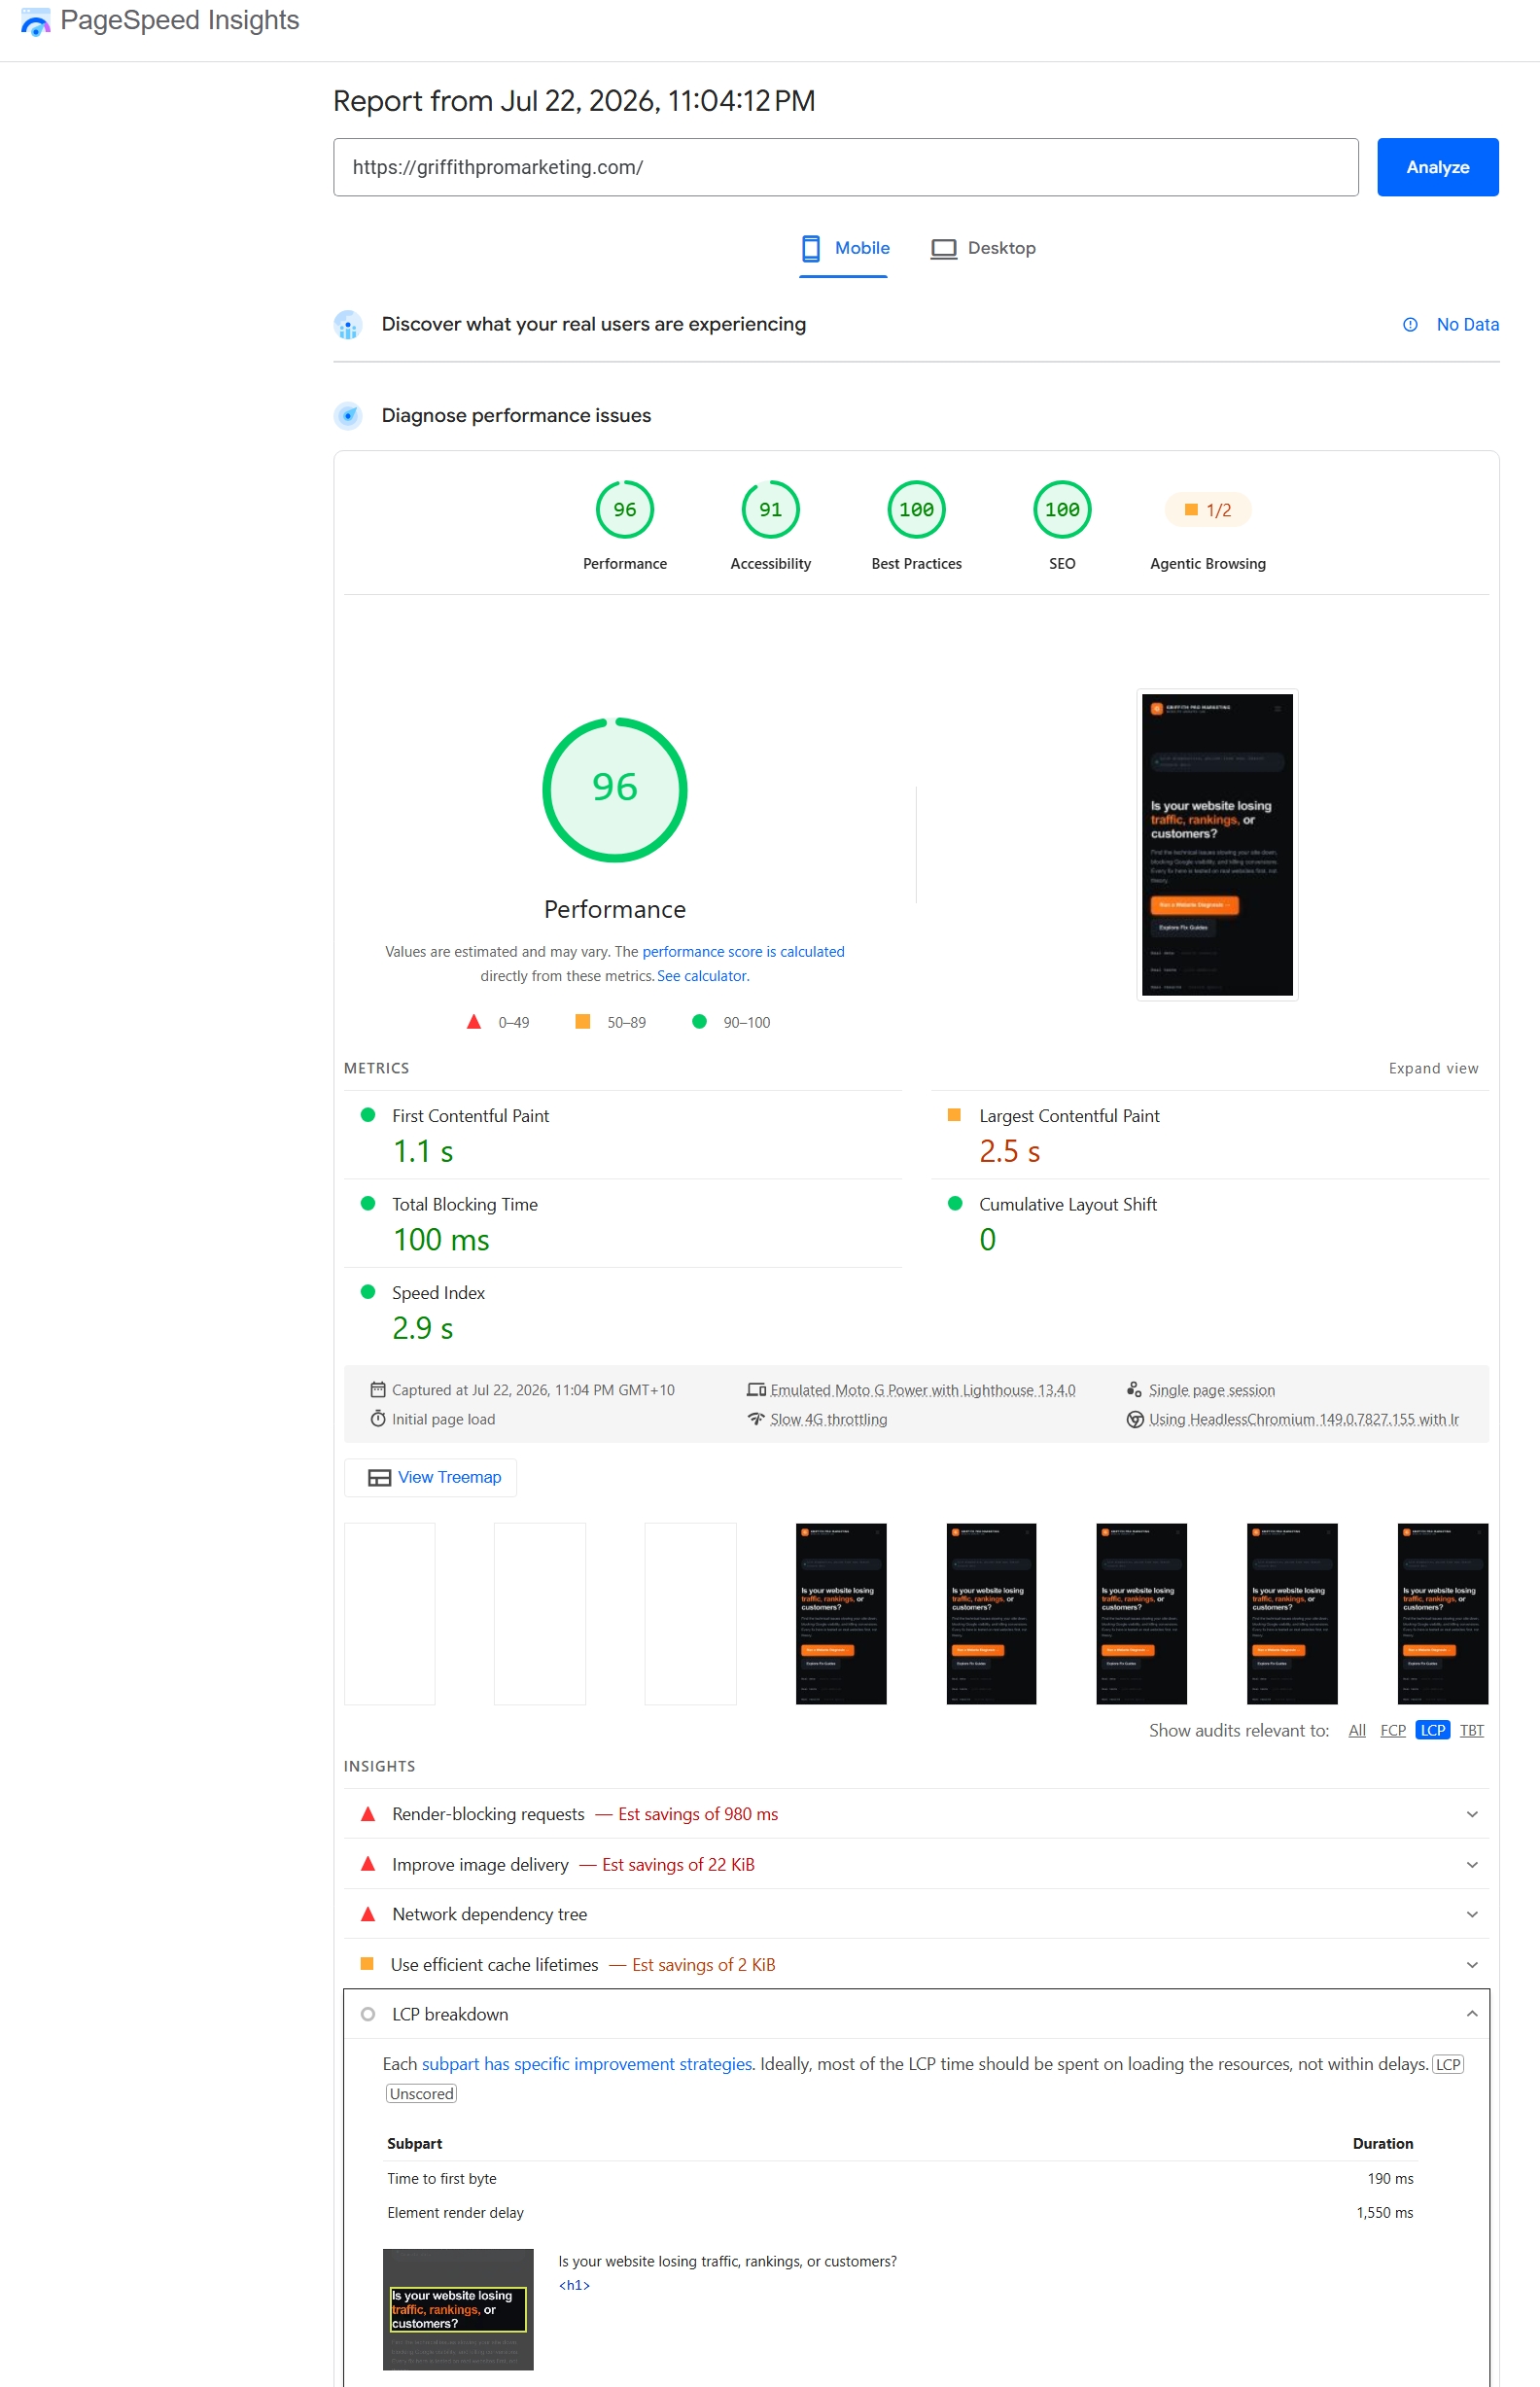
| 11:04pm | Mobile | 96 | 190ms | 1,550ms |
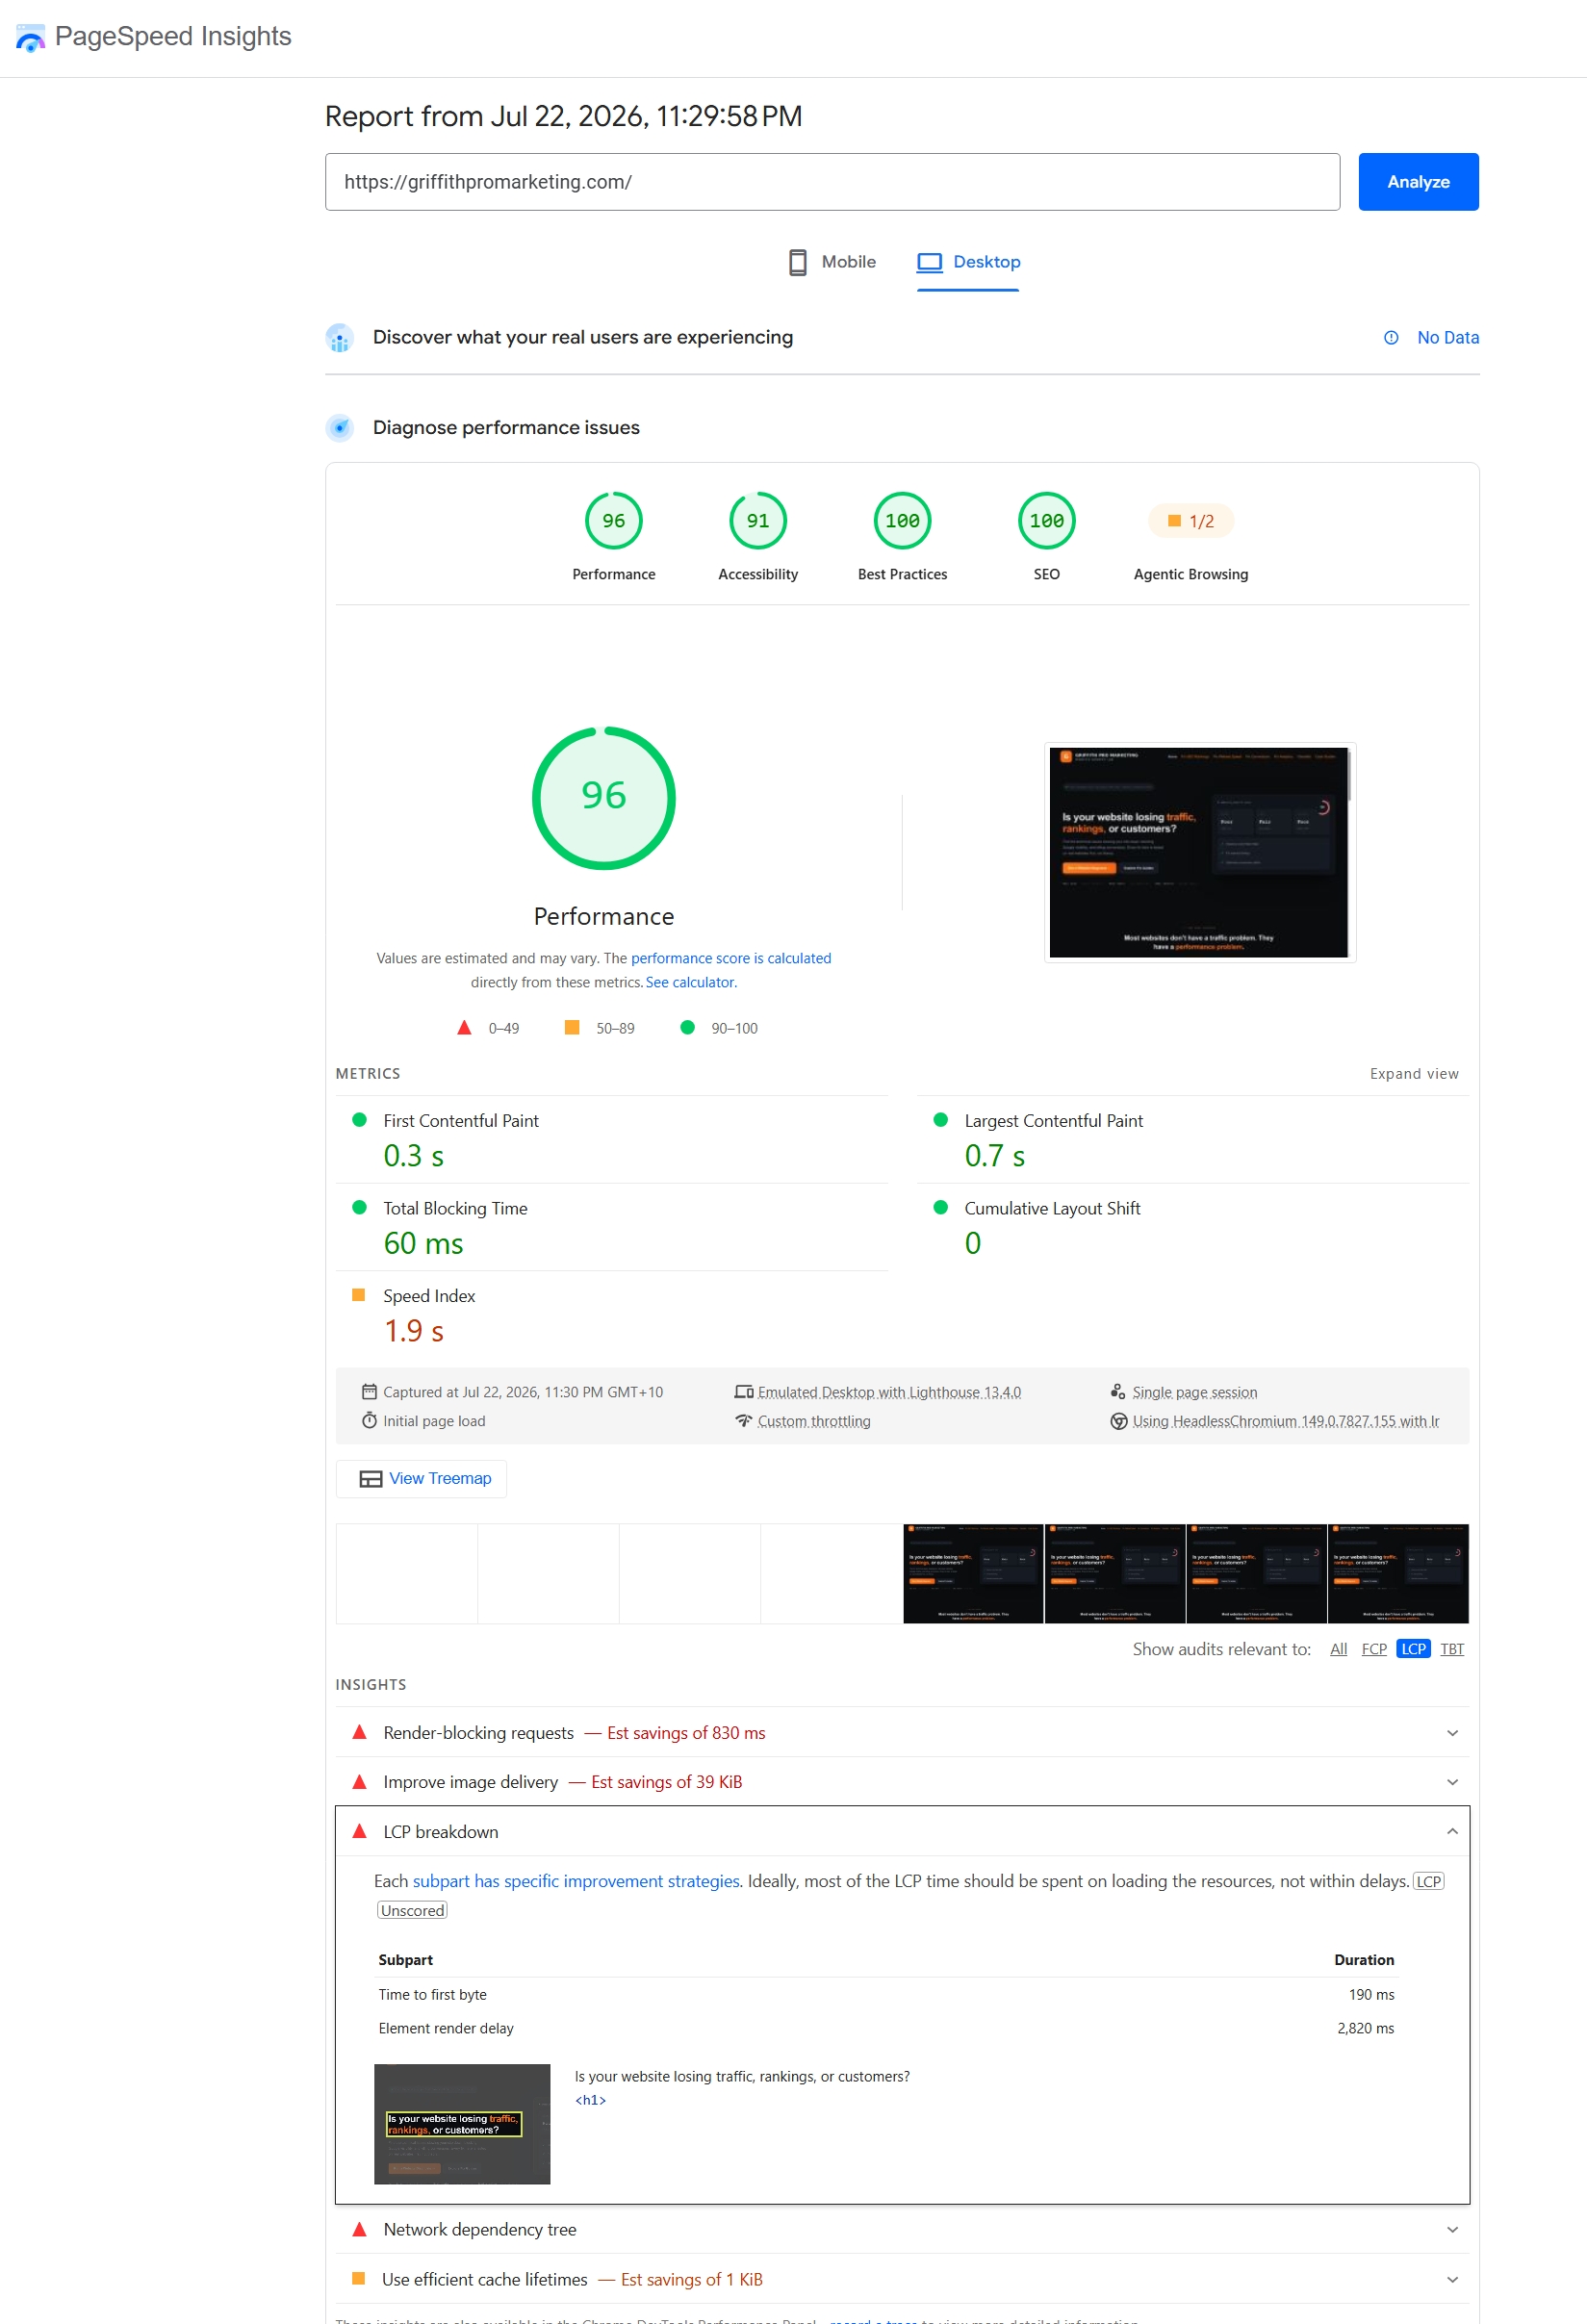
| 11:29pm | Desktop | 96 | 190ms | 2,820ms |
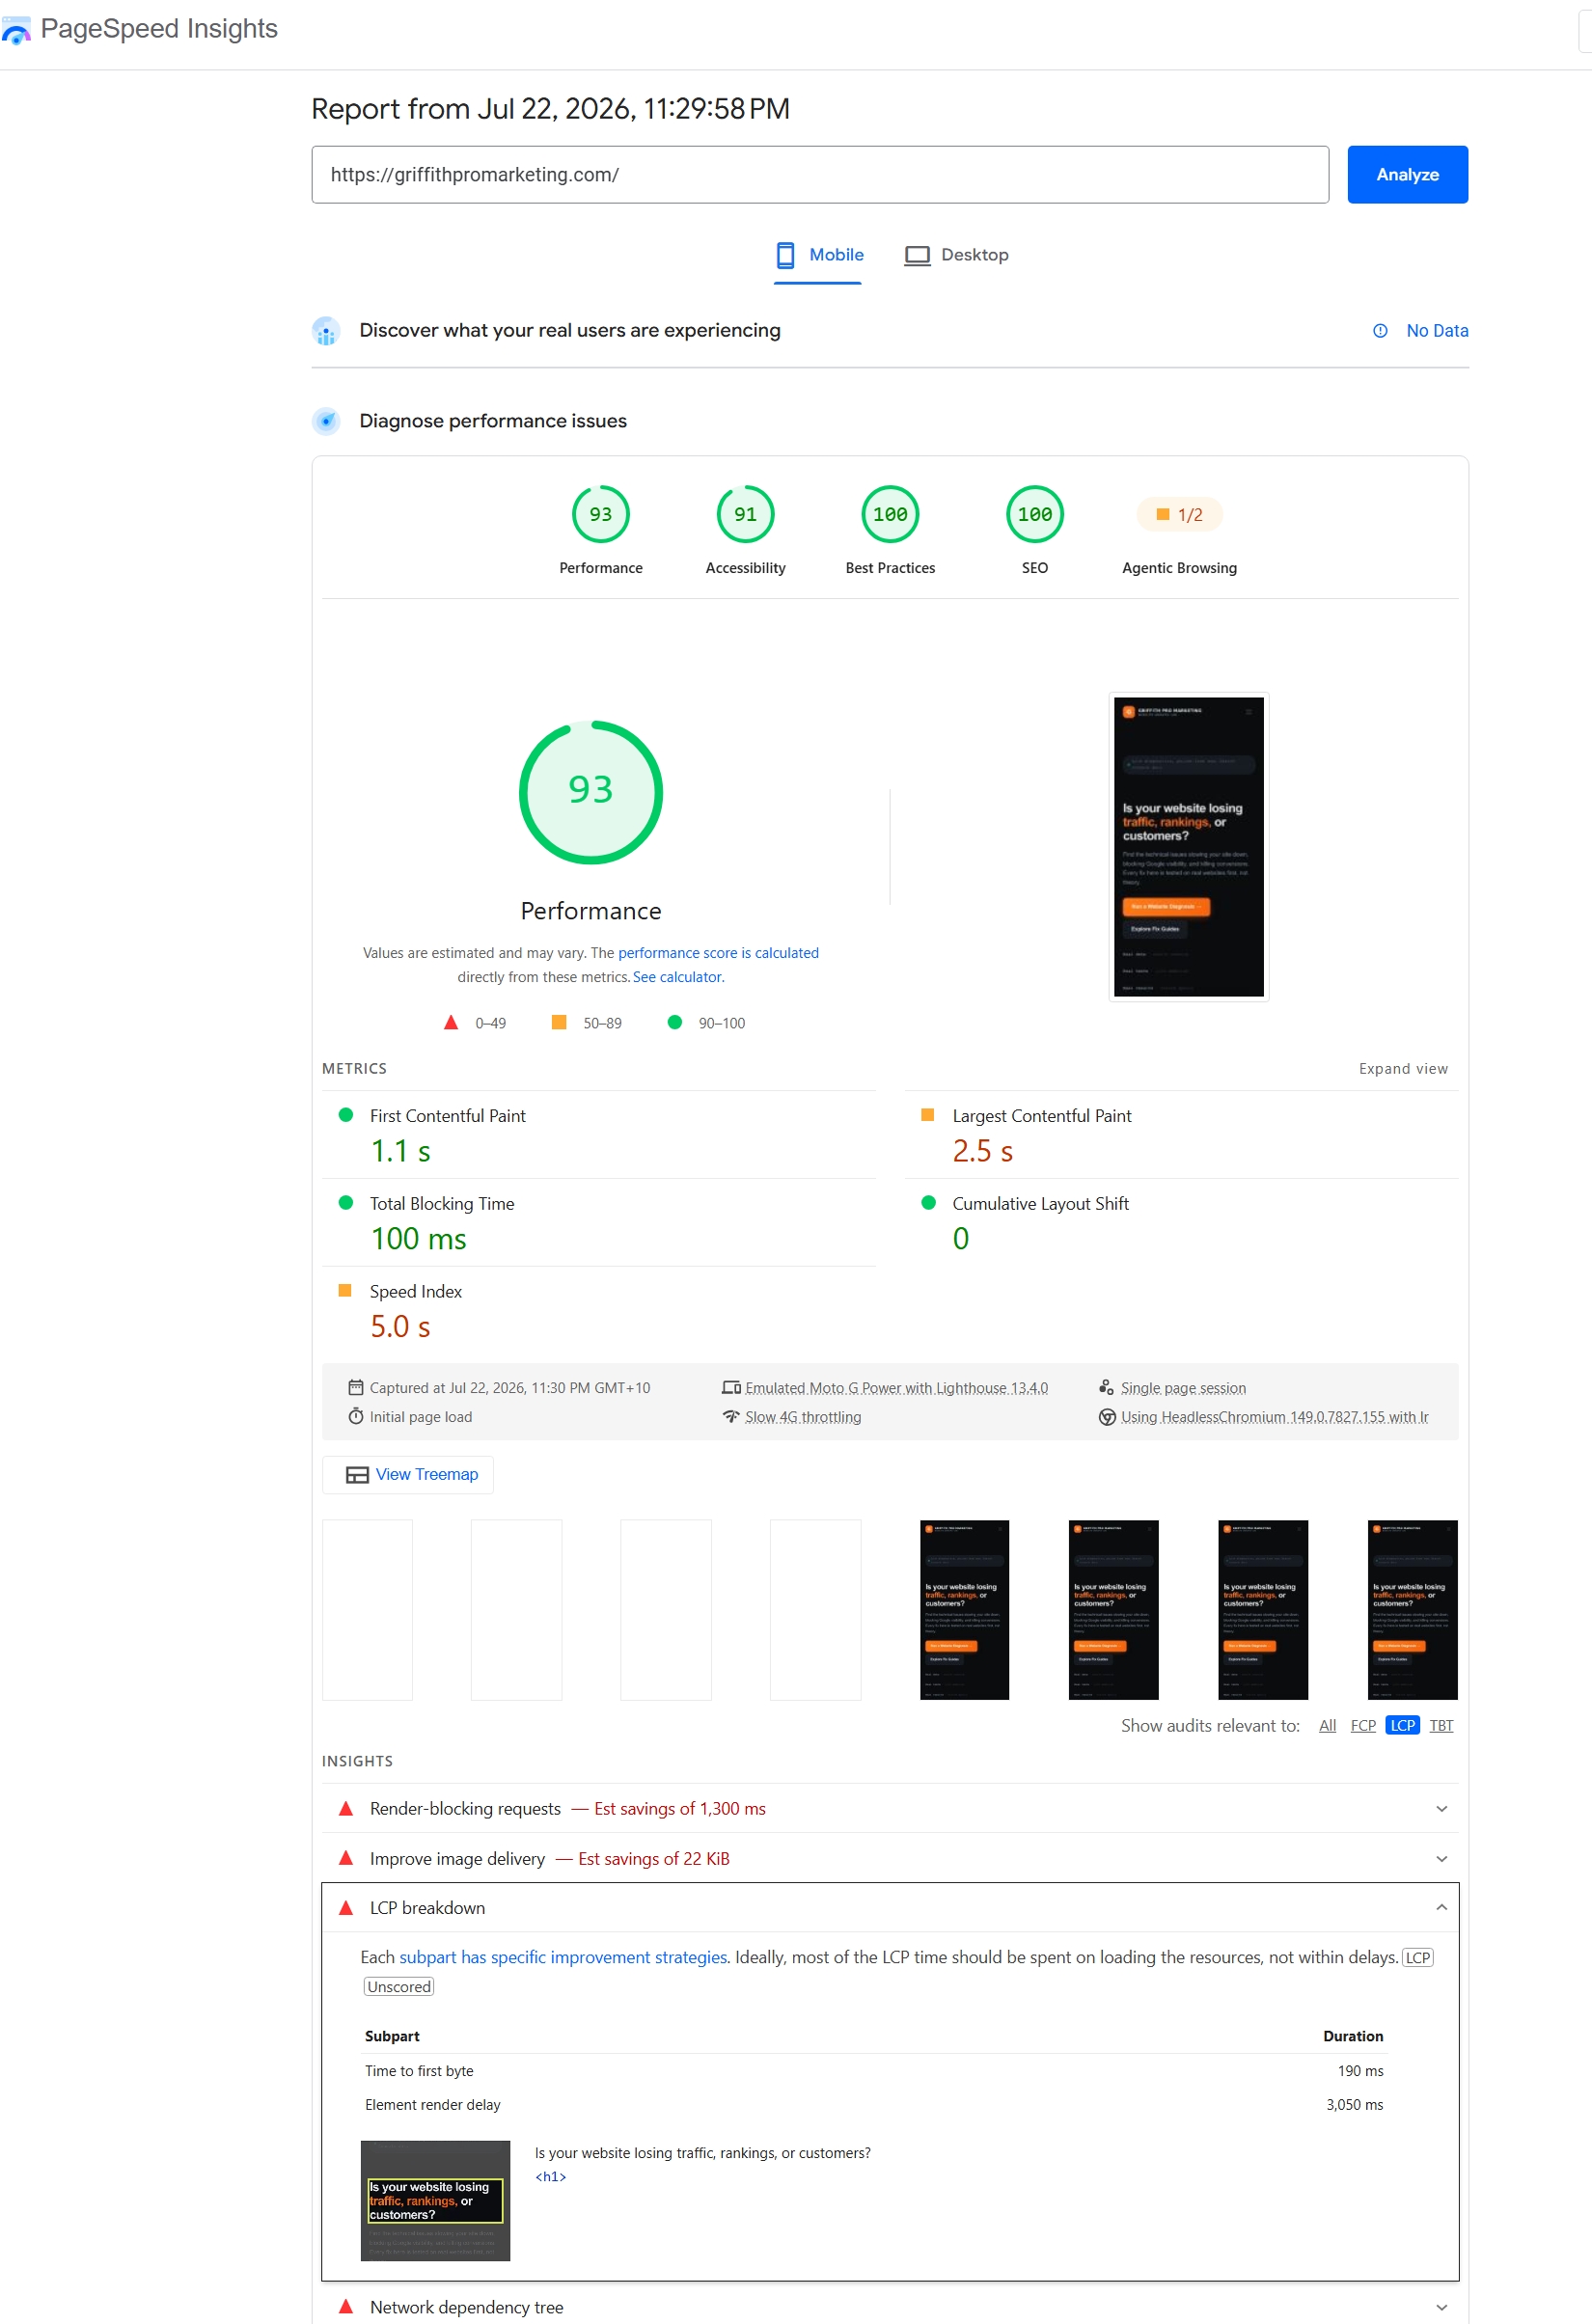
| 11:29pm | Mobile | 93 | 190ms | 3,050ms |
Look at that desktop render delay figure for a second. 1,420ms in the first run, 2,820ms in the second. That’s nearly double, on the same page, with nothing touched in between. If you only ever run PageSpeed once and treat the result as gospel, that kind of swing is exactly how you end up with a number that quietly stops meaning anything. TTFB, meanwhile, didn’t move a single millisecond across either run, either device. One of these numbers is a fact. The other is a fact with a very wide margin of error, and that gap itself is worth understanding before you go anywhere near a fix.
Why mobile and desktop don’t tell the same story
It’s worth pausing on why these numbers don’t match cleanly between device types, because it trips people up when they’re comparing their own results. PageSpeed doesn’t actually load your site on a real phone for the mobile test. It simulates one, specifically an emulated Moto G Power, throttled down to a slow 4G connection, while the desktop test runs largely unthrottled on a much faster simulated machine. So when I say mobile render delay came in at 1,550ms in one run and 3,050ms in another, that’s not your site behaving differently for phone visitors out of some inherent unfairness, it’s the test deliberately recreating a worse network and a weaker processor to represent what a meaningful chunk of real visitors actually experience.
What’s interesting in my numbers is that the mobile and desktop figures were closer together than I expected, and in the second run, mobile’s render delay was actually higher than desktop’s by a decent margin, 3,050ms against 2,820ms. If render delay were purely a network-speed story, I’d expect a much bigger gap between the two, since slow 4G throttling should hurt considerably more than an unthrottled desktop connection. The fact that they’re in the same rough neighbourhood suggests the bottleneck isn’t primarily network transfer time at all, it’s processing time, the browser working through CSS parsing and layout calculation, which a slower simulated CPU on the mobile emulation will struggle with almost as much regardless of how fast the files arrive. That’s a genuinely useful clue, because it points the fix toward reducing what the browser has to process, not just how fast it can fetch it.
Why render delay is the one nobody talks about
TTFB gets all the attention in speed content, mine included, because it’s simple to explain and it maps neatly onto a villain everyone already understands: your host. Slow server, blame the host, switch hosts, problem solved, roll credits. It’s a satisfying story and sometimes it’s even true.
Render delay doesn’t have a tidy villain. It’s not one thing, it’s whatever’s standing between “the browser has the HTML” and “the browser has actually finished figuring out what to draw and drawn it.” That usually means CSS the browser has to fully download and parse before it’s confident it knows how anything should look, JavaScript executing before paint, web fonts the browser is waiting on before it’ll commit to rendering text, or some combination of all three fighting for priority in those first couple of seconds.
Because it’s messier to explain, it gets skipped in a lot of speed advice, including a fair bit of my own past content, if I’m honest. It’s much easier to write “check your hosting” than “go audit your critical rendering path,” even though for a site like mine, the second one was clearly where the actual problem lived.
So I went looking for the actual cause
PageSpeed doesn’t just hand you a render delay number and leave you guessing. Sitting in the same Insights panel, right above the LCP breakdown, is an audit called Render-blocking requests, and this is where the story stopped being abstract and started being specific.
On mobile, PageSpeed flagged an estimated 600ms of directly recoverable savings from render-blocking resources, with a total blocking duration on the critical path of roughly 5.4 seconds across the flagged files. On desktop, the estimated savings sat at 670ms, with the flagged files each taking around 700ms individually.
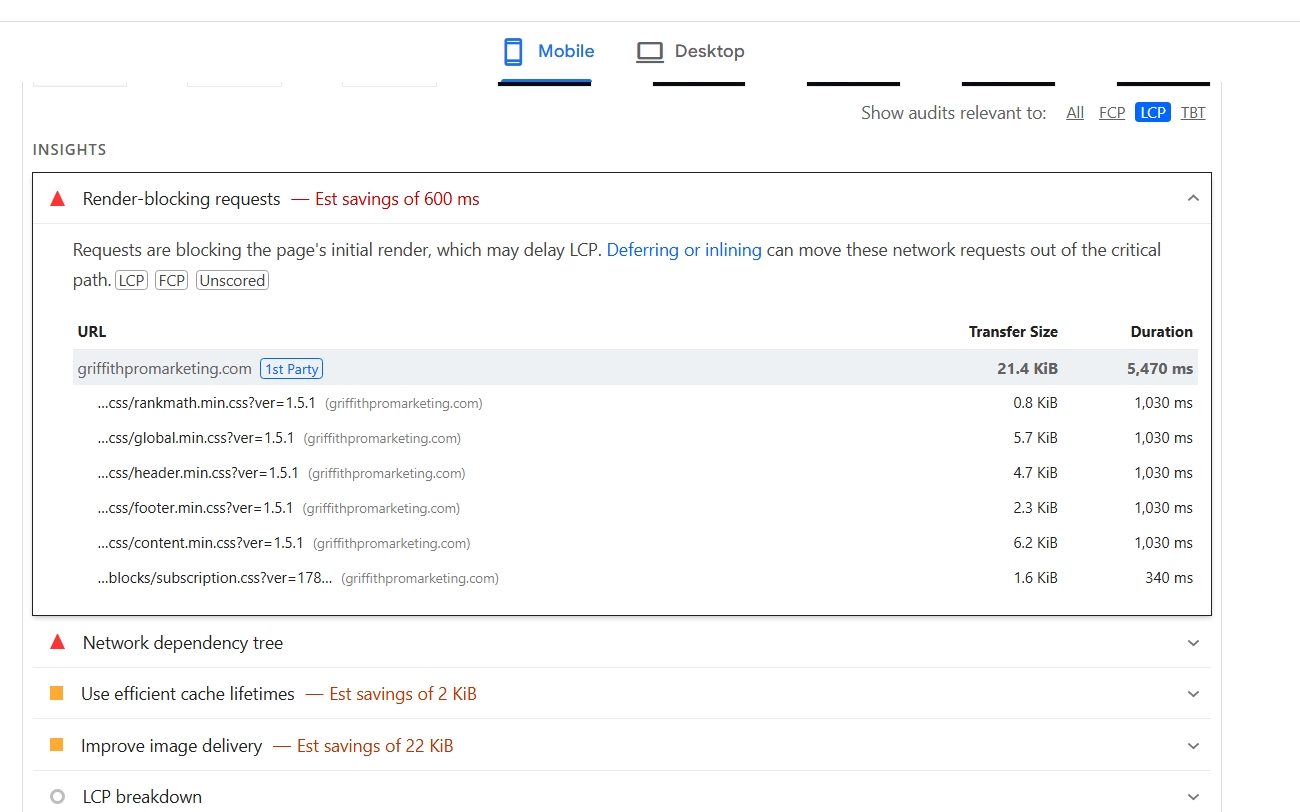
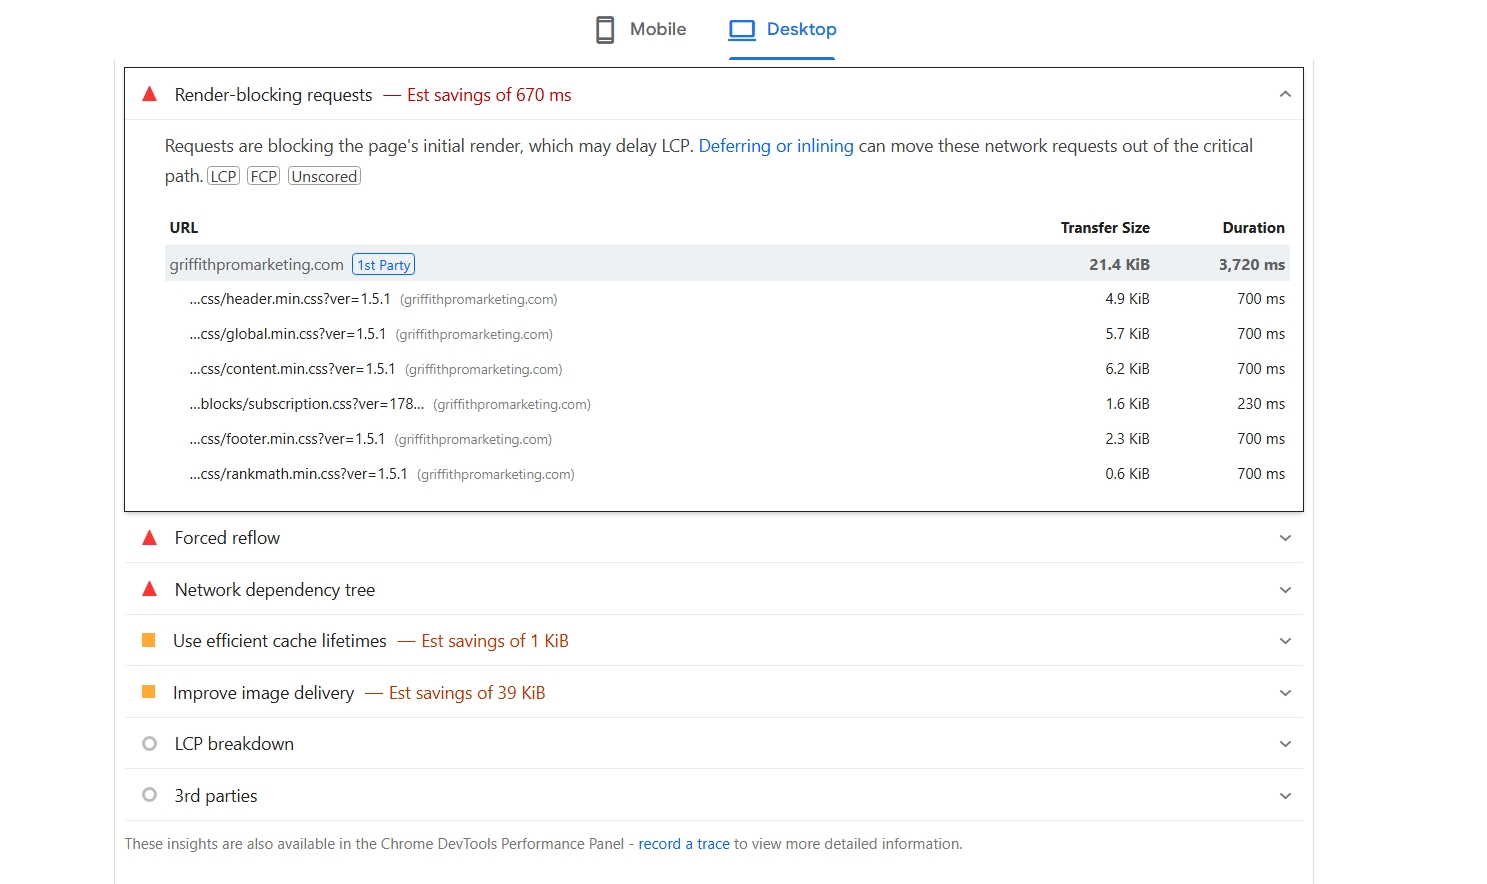
Here’s the part that actually stung a bit. Every single blocking file listed was mine. Not a third-party script, not an embedded widget, not some ad network’s tracking pixel, my own CSS, split across six separate files: rankmath.min.css, global.min.css, header.min.css, footer.min.css, content.min.css, and a subscription block stylesheet. None of them are large on their own, the biggest was around 6.2 KiB, but the browser has to fetch and process every one of them before it’s willing to paint the page, and that adds up fast when they’re loading one after another instead of all at once, or worse, sequentially blocking rather than loading in parallel.
Look closely at the duration column and something else stands out. On desktop, four of the six files, header, global, content, and rankmath, all show an identical 700ms duration. On mobile, five of them show an identical 1,030ms. That’s not a coincidence and it’s not each file genuinely taking exactly the same time to process, it’s a strong signal that these requests are effectively bottlenecked together, likely queued behind the same connection limit or waiting on a shared blocking resource ahead of them, rather than each one independently taking that long. Only the smaller subscription stylesheet breaks the pattern, finishing faster at 340ms on mobile and 230ms on desktop, presumably because it’s small enough to clear whatever’s constraining the others. That repeated, identical duration across unrelated files is exactly the kind of detail a single glance at a topline score would never surface, and it’s the sort of thing worth screenshotting and keeping, because it tells you where to look first: not at any individual file’s size, but at how many separate requests are competing for attention in that critical window before anything can paint.
The genuinely uncomfortable bit is that I already have WP Rocket installed and active on this site. WP Rocket has settings built specifically to deal with exactly this problem, combining CSS files down into fewer requests, removing unused CSS rules, deferring non-critical styles so they load after the initial paint rather than before it. Based on what showed up in this audit, either those settings aren’t switched on, or they’re not catching everything they should be. I genuinely don’t know which yet. That’s not a great look for someone who’s written a whole review of the plugin, but I’d rather say that plainly than pretend the problem doesn’t exist because it’s a little embarrassing.
What this means if you’re reading this about your own site
If you’ve read any of my other speed content, you’ll know the refrain by now: don’t trust a single number, and don’t trust the absence of a red flag either. This is the render-delay version of that same lesson, and it’s worth spelling out plainly because it inverts the usual advice.
A green Performance score doesn’t mean nothing’s wrong. My mobile score sat at 96 in the first run, genuinely excellent by any normal reading, and it still had 1.55 seconds of render delay sitting quietly underneath that headline number. The topline score is an aggregate, and aggregates are very good at hiding a specific, fixable problem inside an otherwise decent-looking result.
A fast TTFB doesn’t mean your site is fast. This is the one that trips people up most, because it’s the exact opposite of the advice that gets repeated everywhere, hosting content very much included, some of mine too. If your host is answering in under 200ms and your site still feels sluggish, the fix almost certainly isn’t a hosting upgrade. You’d be paying more money to solve a problem that was never actually about your server.
And a single PageSpeed run tells you less than it feels like it does. I said this in the Cloudways piece and I’ll say it again here because the swing I saw firsthand, 1,420ms to 2,820ms on the exact same desktop page, is bigger than most people would guess is possible from natural run-to-run noise. If you’re going to make a decision, spend money, or publish a claim based on a PageSpeed number, run it more than once first.
What actually causes render-blocking CSS, in plain terms
It’s worth slowing down here, because “render-blocking” is one of those phrases that gets thrown around in speed content without much explanation of what’s actually happening.
When a browser loads a page, it starts building what’s called the DOM, essentially a structural map of the HTML. At the same time, it needs to figure out how everything should look, which means it has to fetch and read the CSS. Here’s the catch: by default, browsers won’t paint anything to the screen until they’ve finished downloading and processing all of the CSS in the head of the document, because painting with incomplete style information risks showing the visitor something that then visibly jumps or reflows once the rest of the styles arrive. So the browser waits. Every stylesheet linked in that critical path is one more thing it has to wait on before it’s allowed to show anyone anything.
Six separate stylesheet requests, each with its own connection overhead and processing time, stacked in sequence rather than combined or deferred, is a completely ordinary way to end up with over a second of pure waiting before a single pixel of your actual content appears. None of the individual files did anything wrong. The problem is the accumulation and the sequencing, not any one file being bloated or badly written.
The usual fixes, and I want to be upfront that I haven’t finished implementing these yet, so this isn’t a victory lap, are combining stylesheets where it’s safe to do so, identifying and inlining the small amount of CSS actually needed to render what’s visible above the fold, and deferring everything else so it loads after that first paint rather than blocking it. This is precisely the territory WP Rocket’s CSS optimisation settings are built for, and it’s precisely where I need to go back and check my own configuration rather than assuming a plugin being installed means a setting being correctly applied.
What I’m actually going to do about it
I’ll be straightforward: as of writing this, I haven’t fixed it yet. I’ve found it, I understand roughly why it’s happening, and I have a reasonably clear idea of where to look first, but I don’t want to write a tidy “and then I fixed it” ending that hasn’t actually happened, because that’s exactly the kind of manufactured resolution I’ve been trying to avoid across this whole diagnostic process.
Here’s the actual order I’m going to work through, and why each step comes where it does. First, Remove Unused CSS, since that’s usually the biggest single lever available, and it directly targets what this audit found: files being loaded in full when only a fraction of their rules are actually needed for what’s visible on a given page. RankMath’s stylesheet, for instance, likely carries styling for schema markup boxes, breadcrumb formatting, and other features that don’t apply to every single page template, so a homepage might be downloading and parsing CSS rules it never uses. Second, checking whether Combine CSS Files is switched on, since six separate HTTP requests each carry their own overhead beyond just file size, and cutting that down to one or two requests should reduce however much of the delay is coming from connection and queuing time rather than actual processing. Third, and this is the one I’m least certain about without testing it directly, looking at whether critical CSS generation is enabled, which would let the browser paint using just the minimal styling needed for the visible portion of the page immediately, while the rest loads in behind it rather than blocking that first paint entirely.
The reason I’m not just switching all three on at once and calling it done is that WP Rocket’s CSS optimisation features can occasionally clash with page builder or theme-specific styling if they’re too aggressive, stripping out a rule that turns out to be needed after all and breaking some part of the layout. So the honest process is one change at a time, a fresh three-pass PageSpeed test after each, and a visual check of the site itself before moving to the next setting, rather than flipping every switch simultaneously and hoping nothing breaks. Slower, but it means if something does go wrong, I’ll actually know which change caused it.
What I will be doing, in order: going back through my WP Rocket file optimisation settings properly rather than assuming defaults are doing their job, checking whether Remove Unused CSS and the critical CSS generation feature are actually switched on and functioning, since a plugin sitting installed but misconfigured is functionally the same as not having it at all, and then re-running the same multi-pass PageSpeed test afterward to see whether render delay actually drops, or whether there’s a second, less obvious cause still hiding underneath this one.
I’ll update this post, or link through to a follow-up, once that’s done, with the actual before-and-after numbers, not a summary of what I expect to happen.
Where this leaves the hosting question
This is worth closing the loop on, since it’s the reason I went looking for TTFB in the first place. None of what I found here changes my TTFB number, and none of it is something a hosting upgrade would touch. Render-blocking CSS is a front-end problem, it exists identically whether the HTML behind it is served from a shared hosting box or the most expensive dedicated cloud server available. Moving hosts would not have fixed this. I want to say that plainly rather than let the two stories blur together, because it would be easy, and dishonest, to let a reader walk away thinking a hosting migration also solved this problem when the two are almost completely unrelated.
If you’ve read the Cloudways piece, you’ll know I’m still migrating, for scalability and headroom reasons that have nothing to do with this specific finding. This post is the other half of that same honesty: hosting wasn’t my bottleneck, and now you know what actually was, and roughly why, even before I’ve finished fixing it.
The actual takeaway, if you only remember one thing
Test both numbers, not just the one that’s easy to blame on someone else. TTFB tells you about your server. Render delay tells you about everything your browser has to do after your server’s already finished its job, and for a lot of sites, mine very much included, that second stretch is where the real time is actually going. A fast server can still sit underneath a slow-feeling site, and the only way to know which one you’re dealing with is to actually expand that breakdown and look, rather than assuming a green score or a quick TTFB check has told you the whole story.
Dewi