
Chasing 1,000 Monthly Visitors: What My Search Console Actually Showed Me
I did something a bit premature a few weeks ago. I applied to HubSpot’s affiliate program.
I’d been checking Search Console most days by that point, watching the numbers move around, and I genuinely thought I was in reasonable shape. The site had content, it had structure, it was getting crawled properly. I filled out the application feeling fairly good about my chances. I even mentioned a bit of activity I’d been building on TikTok, thinking a growing audience there would count in my favour.
Then this landed in my inbox.
Two rejections in one paragraph, really. Fair enough, I thought. I probably just need to double check the number. So I went back into Search Console to confirm.
The Number I Thought I Had
Here’s what I was looking at over a rolling three month window.
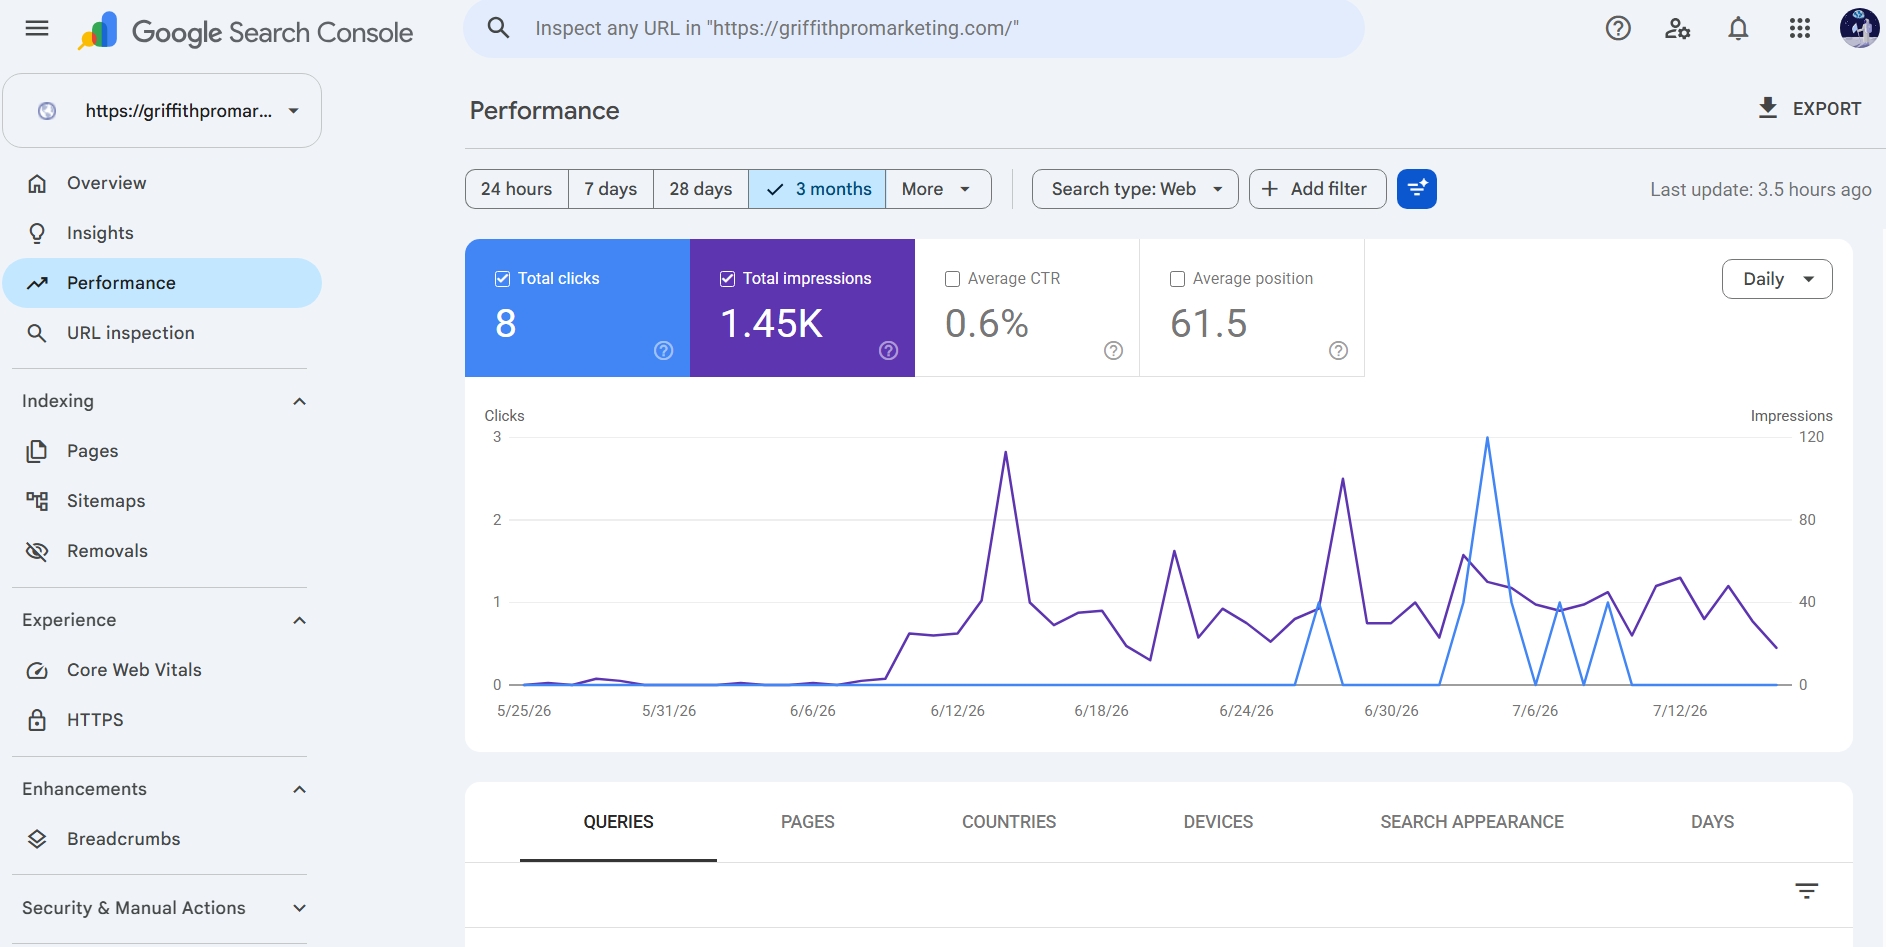
8 total clicks. 1.45K total impressions. Average position 61.5, over a 3 month window.
That 1.45K number is the one I’d been quietly leaning on in my head without really interrogating it. It looks like a real, respectable traffic figure. It is not.
Impressions just mean my listing appeared somewhere in a Google results page. Somebody scrolled past it, or it sat on page six of results nobody ever reaches. It says nothing about whether a person actually landed on my site.
The number that actually matters, sitting right next to it in blue, was 8. Eight clicks. Over three months. That’s the real organic traffic Google search sent me in that entire window.
The CTR Number I’d Also Been Ignoring
Sitting between clicks and average position is another figure most beginners skim straight past: average CTR, or click-through rate. Mine sat at 0.6% over three months, and 0.7% over the last 28 days.
CTR is simply the percentage of people who saw my page in the results and actually clicked it. Out of every 1,000 times my site appeared somewhere in a search result, roughly six or seven people clicked through. Everyone else scrolled past, clicked a different result, or never scrolled far enough to see mine at all.
A healthy CTR for a page ranking near the top of page one is often somewhere in the 20 to 30% range, sometimes higher for a well-written title. Mine being under 1% isn’t really a title-writing problem though. It’s mostly a position problem. When you’re averaging position 61, most of your impressions are happening on a results page nobody scrolls to, so even a great headline barely gets seen.
That’s actually a useful thing to know, because it tells me where not to waste time. Rewriting titles and meta descriptions right now would be optimising the wrong layer. Position needs to improve first. CTR follows position, not the other way around, at this stage.
Why I Didn’t Catch This Sooner
I think the honest answer is that 1.45K is a satisfying number to glance at, and I let myself glance rather than actually read it.
This is the same trap I fell into early on with this whole site, watching my average position slowly climb from 69.1 to 66.8 to 61.5 over the weeks and treating each small move as proof things were working. Progress was real. It just wasn’t the same thing as traffic.
I’d written about exactly this pattern before, in a piece about why new websites don’t rank yet, the excitement of watching a new site slowly get noticed by Google. Applying that lesson to myself while I was living through it, apparently, is a different skill to writing about it in the abstract.
There’s a specific kind of self-deception that happens when you’re both the person building a site and the person measuring it. You want the numbers to mean something, so you reach for the interpretation that lets them mean something. Impressions over clicks. A shrinking 28-day average over a flatter 3-month one. Anything that lets the story be “it’s working” rather than “it’s early.”
What “Average Position” Actually Means
There’s a fourth number on that same screen, average position, and it took me longer than I’d like to admit to actually understand what it was telling me. If you’re new to Search Console, this one trips almost everyone up at first, so it’s worth slowing down on.
Average position tells you roughly where your pages tend to land in Google’s results. Position 1 means top of the first page. Position 10 is the very bottom of page one. My number, 61.5, means my pages are averaging somewhere around page six or seven of the results. Lower is better. Higher is worse, the opposite of what feels intuitive if you’re used to “bigger number, better result.”
It’s also an average across every single query and page that got even one impression, so one page ranking well and another ranking badly still blend into one middle-ground number. It hides a lot of detail, but it’s still a useful direction to watch.
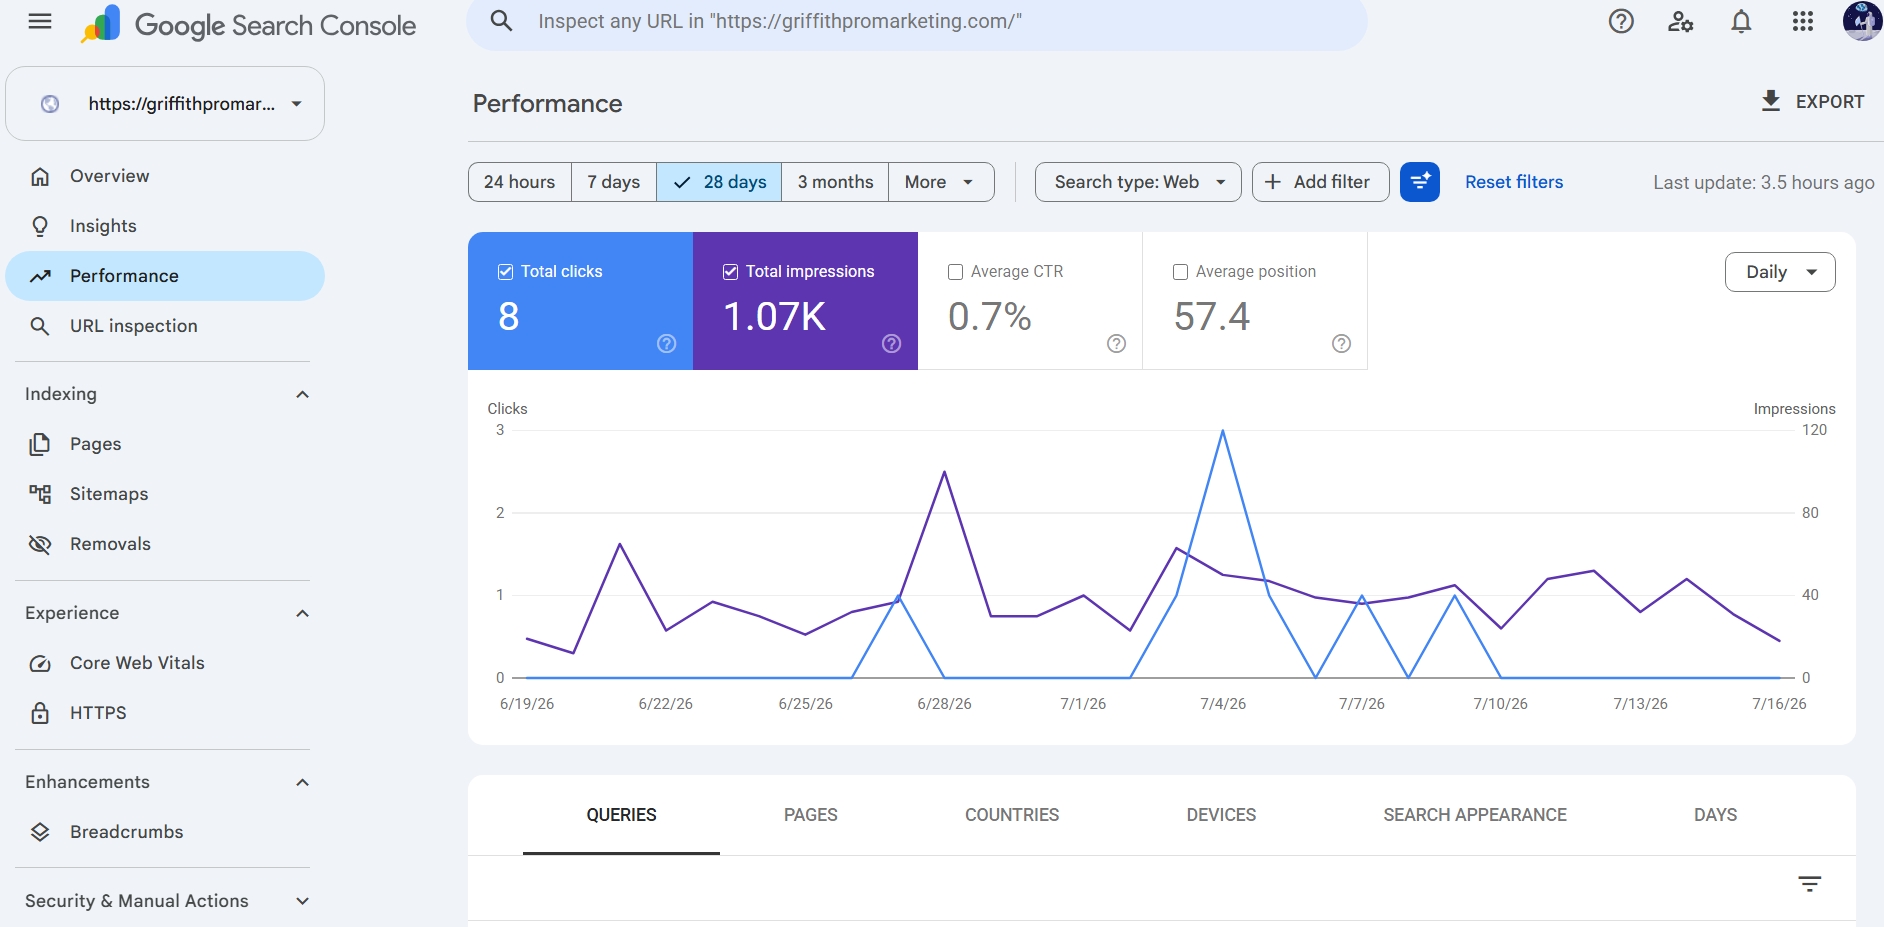
The same site, narrowed to the last 28 days. Average position 57.4, better than the 3 month figure above.
Here’s where I actually confused myself. My 28 day average position was 57.4. My 3 month average position was 61.5. Since 57.4 is a smaller number, that’s better, closer to page one, so for a moment I read this as things getting worse the further back you zoom out.
What’s actually happening is simpler once you see it. The 3 month window includes those same last 28 days, plus roughly two extra months before that. Those earlier months were performing worse, further down the results, higher position numbers. Blend two so-so months with one better month, and the overall 3 month average gets pulled upward, worse, by the weaker older data sitting inside it.
It’s the same as a school grade average. Score 40% on your first couple of tests, then 70% on your most recent one, and your semester average still sits well below 70%, dragged down by those early results. That doesn’t mean the most recent test went badly. It means recent performance is genuinely better than the overall average lets on.
So the real signal in my two numbers isn’t “things got worse over three months.” It’s “the last 28 days were better than the three months before them,” which is a mildly encouraging sign, not a warning one.
What the Queries and Pages Tabs Actually Show
Underneath the main graph, Search Console gives you tabs for Queries, Pages, Countries, Devices, Search Appearance, and Days. Most of these matter less right now given how small my numbers are, but two are worth checking regularly even at this stage.
Queries shows the actual search terms people typed before landing on, or almost landing on, my site. With only 8 clicks to work with, this list is short, but it’s genuinely revealing. It tells me which specific phrases are already working, even a little, so I know what to double down on rather than guessing.
Pages shows which individual URLs are pulling in whatever impressions and clicks exist. If one page is quietly doing more work than the rest, that’s the page worth strengthening first, adding more internal links to it, expanding it, making sure it’s technically sound, rather than spreading effort evenly across everything.
Neither tab replaces the top-line numbers. But they’re where the next actual decision comes from, not just “am I doing okay” but “what specifically should I do next.”
What Direct Traffic and Clicks Are Really Telling Me
Once I stopped looking at impressions and started looking at the numbers that actually count, the picture got a lot clearer, and a lot smaller.
My WP Rocket affiliate link has picked up a small handful of clicks since going live, along with one actual sale. My Rank Math affiliate link has had 8 clicks and zero conversions so far. Both numbers are genuinely fine for a site this young, but neither one is hiding a secret 1,000 visitors a month anywhere.
Google Analytics 4 will give me the full picture eventually, direct visits, social, everything Search Console can’t see. I haven’t pulled that screenshot yet, but I’d be surprised if it changes the overall story much.
What I’m Actually Doing About It
Rather than treat the rejection as a setback, I’ve turned it into a checklist, since it’s a genuinely useful forcing function.
Keep publishing. The ranking cluster on this site is still growing, and a site with fifteen to twenty connected articles clears the early trust period faster than one with five scattered ones. I already know this. I just need to keep doing it, on a schedule, not in bursts whenever I feel motivated.
Get real backlinks. This is the piece I’ve genuinely neglected. A few genuine mentions from other sites would do more for this than another week of polishing existing content. Realistic starting points for a site my size: local Australian business directories, a couple of past clients who have their own sites and might mention the work, and maybe one guest post on an adjacent WordPress or small business blog. Nothing dramatic, just real.
Double check indexing. I’ve already written about one Search Console data gap on this site, worth confirming nothing’s still sitting unindexed and invisible. A page that isn’t indexed contributes exactly zero to any of these numbers, no matter how good it is.
Target smaller, sharper keywords. Broad terms are years away for a site this size. The narrower, higher-intent pages, the ones closer to what someone’s actually about to do, like my WP Rocket case study, convert and rank faster than anything chasing a broad term. Someone searching “WP Rocket vs free plugins” is much closer to a decision than someone searching “digital marketing.”
Don’t ignore the technical basics. Site speed is one of the quieter factors sitting underneath all of this. Google crawls faster sites more efficiently, and a slow page loses whatever tiny trickle of traffic it does get before someone even reads it. I already went through fixing this on my own site, LCP down from 4.1 seconds to 718 milliseconds, which is exactly the kind of foundational fix that has to happen before content and links can do their job properly.
Build a second channel. Waiting on Google alone is slow. A following somewhere else, LinkedIn most likely given who actually reads this site, doesn’t depend on anyone’s algorithm trusting me yet. It also happens to be a channel affiliate programs generally respect, unlike TikTok in HubSpot’s case, so it does double duty.
Setting a Realistic Timeline Instead of a Wish
The version of me who applied to HubSpot early was implicitly hoping for a shortcut. There isn’t one, and pretending otherwise just sets up another rejection later, whether from an affiliate program or from my own expectations.
Realistically, based on what I’ve seen work on other sites and what I’ve written about the early sandbox period, three months of consistent publishing is roughly where long-tail keywords start showing real movement. Six months is where regular, non-trivial traffic tends to show up. Twelve months is where a site like this typically has enough authority and content depth to comfortably clear something like a 1,000-visitor threshold, assuming the publishing and linking actually happened along the way rather than stalling out.
That’s not a guarantee, it’s a pattern, and patterns can be beaten or missed depending on how consistently the work actually gets done. But it’s a far more honest planning number than “I’ll check back in a few weeks and see if it magically clears.”
Where This Actually Leaves Me
I’m not reapplying to HubSpot yet. There’s no version of my current numbers that gets me there honestly, and presenting impressions as if they were visitors is exactly the kind of thing that would burn a partnership permanently rather than just delay it.
What I do have is a clear, boring, and genuinely doable list. Publish. Get a few real links. Fix what’s broken. Check back in a few months with real numbers instead of a number I was hoping was real.
If you’re sitting somewhere similar, checking Search Console daily and feeling good about a number that turns out to be impressions rather than visits, you’re not doing anything wrong. It’s an easy number to misread. Just don’t let it sit unchecked the way I did.